
Ultra-fast rendering
measured against V4
With Direct2D GPU rendering, ReoGrid V5 draws each scrolling frame 2.7–6.2× faster than V4, and puts a million rows of data on screen 21× faster. Every number here comes from the shipped V4 and V5, run on the same PC with the same data in the same window.
6.2×
faster scrolling than V4, at most
2.19 ms
per frame (V4: 6.33 ms)
21×
faster to show 1,000,000 rows
75×
Store 10 million text cells
Scrolling
The time to draw one frame
A frame here is one notch of the mouse wheel — three rows — followed by a repaint of the whole 1400 × 900 grid. Drawing with Direct2D, V5 is 2.7–6.2× faster than V4 on every sheet. The widest gap is on a sheet of Japanese and English text: 1.39 ms against V4's 8.63 ms.
Near the end of a 1,000,000-row sheet, or on a sheet with 50,000 merged cells, a frame takes about as long as on a 100,000-row sheet (2.17 ms and 2.28 ms with Direct2D). Scrolling stays just as light as the sheet grows.
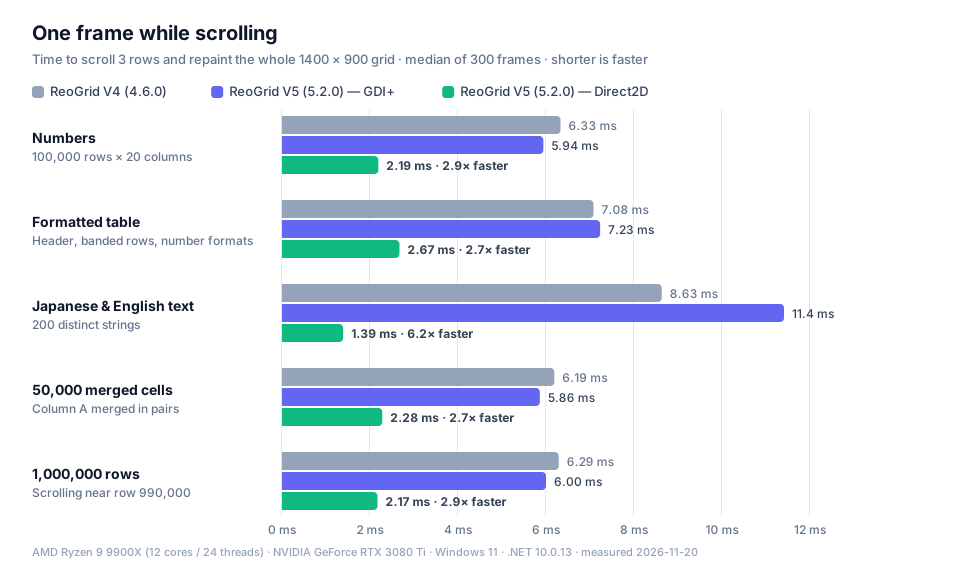
| Sheet | V4 | V5 GDI+ | V5 Direct2D | vs V4 |
|---|---|---|---|---|
| Numbers 100,000 rows × 20 columns | 6.33 ms | 5.94 ms | 2.19 ms | 2.9× |
| Formatted table Header, banded rows, number formats | 7.08 ms | 7.23 ms | 2.67 ms | 2.7× |
| Japanese & English text 200 distinct strings | 8.63 ms | 11.4 ms | 1.39 ms | 6.2× |
| 50,000 merged cells Column A merged in pairs | 6.19 ms | 5.86 ms | 2.28 ms | 2.7× |
| 1,000,000 rows Scrolling near row 990,000 | 6.29 ms | 6.00 ms | 2.17 ms | 2.9× |
Median time per frame (300 frames × 3 runs). Shorter is faster.
On GDI+, about as fast as V4
By default the V5 WinForms control draws with GDI+, as V4 does, and at about the same speed: V5 is slightly faster on numbers and merged cells (6.33 ms → 5.94 ms), and V4 is faster on a sheet full of Japanese text (8.63 ms against 11.4 ms). When drawing speed matters, switch to Direct2D with one property.
Smoothness
Room to spare in every frame
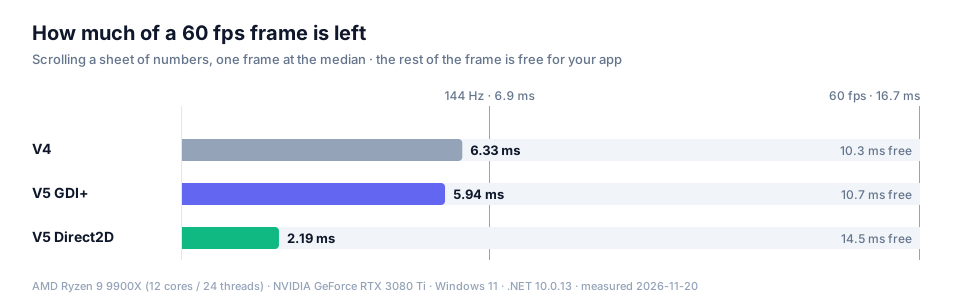
To run at a smooth 60 fps, each frame has to be drawn within 16.7 ms. V5 with Direct2D draws a sheet of numbers in 2.19 ms, leaving 14.5 ms of every frame for your application's own work. V4's 6.33 ms only just fits a frame on a 144 Hz monitor (6.94 ms); V5 with Direct2D needs less than a third of that.
Live data
Light on screens that never stop changing
On a live board of prices, sensor readings or production counts, new values reach the visible cells every frame. Writing a new value into all 810 visible cells (45 rows × 18 columns) and redrawing, one frame takes the following. V4 is measured its fastest way: screen updates and events suspended, values written as one block.
V4
6.52 ms
baseline
V5 GDI+
5.96 ms
1.1× V4
V5 Direct2D
4.19 ms
1.6× V4
WPF and Avalonia got faster in 5.2 too
The drawing numbers on this page are for the WinForms control. In 5.2, WPF and Avalonia started spending almost no time redrawing cells whose values have not changed, for frames about 7× and up to 8× faster. See the article on Direct2D and the 5.2 speed-ups.
Large data
A million rows on screen, 21× sooner
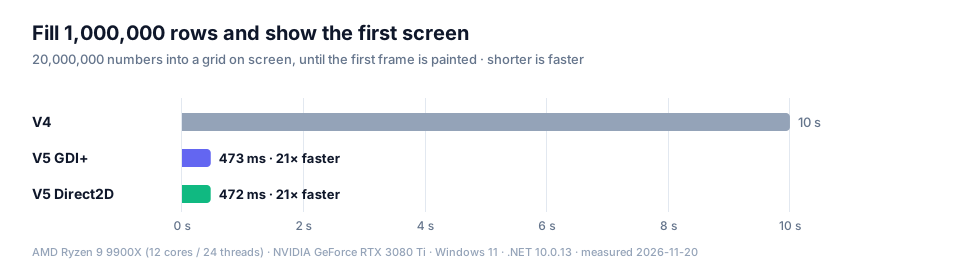
The time to put 1,000,000 rows × 20 columns of numbers (20 million cells) into a grid on screen and finish painting the first frame: 10 s for V4, 473 ms for V5 — your users can start working right after the data loads. V4 is measured its fastest way, writing the values as one 2-D array.
Data operations
Faster without a screen, too
Loading data, applying formatting, inserting rows and reading and writing xlsx got faster as well. Storing 10–20 million values is 27–75× faster, and formatting a populated range 15× faster — the same gains apply when you build workbooks on a server or in a batch job.
Operations that were already quick — sorting, opening an xlsx file, reading a single cell — gain 1.2–1.4×. The chart and the table list every operation measured, including the ones with little difference.
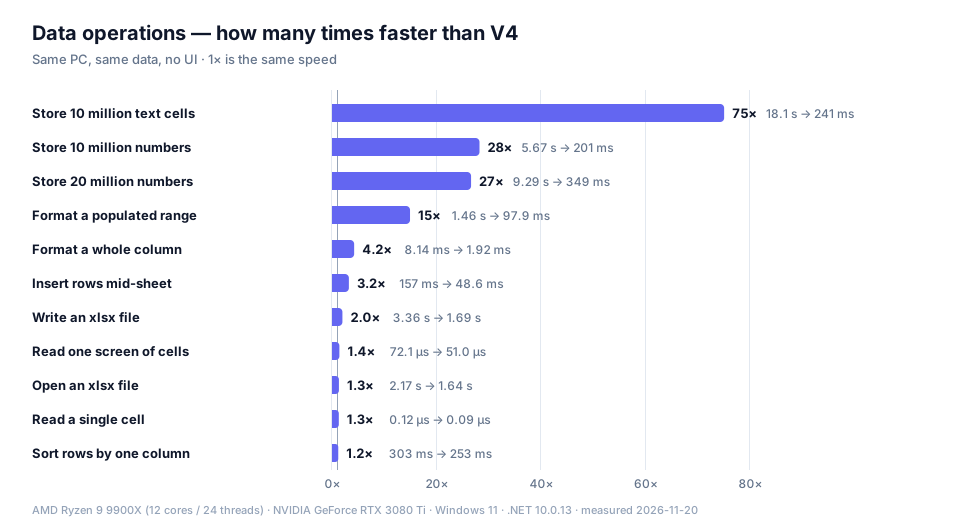
| Operation | V4 | V5 | vs V4 |
|---|---|---|---|
| Store 10 million text cells 200,000 rows × 50 columns, 200 distinct strings | 18.1 s | 241 ms | 75× |
| Store 10 million numbers 200,000 rows × 50 columns | 5.67 s | 201 ms | 28× |
| Store 20 million numbers 1,000,000 rows × 20 columns | 9.29 s | 349 ms | 27× |
| Format a populated range 10 million cells | 1.46 s | 97.9 ms | 15× |
| Format a whole column 1,048,576 rows | 8.14 ms | 1.92 ms | 4.2× |
| Insert rows mid-sheet into a sheet of 10 million cells | 157 ms | 48.6 ms | 3.2× |
| Write an xlsx file 2 million cells | 3.36 s | 1.69 s | 2.0× |
| Read one screen of cells 60 × 40 cells, per read | 72.1 µs | 51.0 µs | 1.4× |
| Open an xlsx file 2 million cells | 2.17 s | 1.64 s | 1.3× |
| Read a single cell random positions, per read | 0.12 µs | 0.09 µs | 1.3× |
| Sort rows by one column 100,000 rows | 303 ms | 253 ms | 1.2× |
Median of 3 runs, measured without a screen. V4 runs its bulk-loading path, with events and formula calculation switched off.
WinForms
Direct2D is one property
Set the renderer on the WinForms control and cells are drawn on the GPU, with text laid out by DirectWrite. The workbook and editing APIs behave the same with either renderer, so your application code works as-is.
Where Direct2D cannot run, the control keeps drawing with GDI+, and ActiveRenderer tells you which one is in use. See the WinForms reference.
using unvell.ReoGrid.WinForms;

// One property — GDI+ stays the default
grid.Renderer = GridRenderer.Direct2D;

// Stays on GDI+ where Direct2D cannot run
if (grid.ActiveRenderer != GridRenderer.Direct2D)
    Console.WriteLine("Drawing with GDI+");
How we measured
| CPU | AMD Ryzen 9 9900X (12 cores / 24 threads) |
|---|---|
| GPU | NVIDIA GeForce RTX 3080 Ti |
| OS | Windows 11 |
| Runtime | .NET 10.0.13 (both V4 and V5) |
| Versions | ReoGrid V4 4.6.0 / ReoGrid V5 5.2.0 (WinForms, shipped packages) |
| Window | 1400 × 900 pixels (100%) |
| Measured | 2026-11-20 |
- The same screen for both. The real controls sit in windows of the same size, both with 20-pixel rows and 80-pixel columns, so the same cells are on screen.
- A frame runs from the change to the finished paint, redrawing the whole grid every time. After 60 warm-up frames, 300 frames are measured; the figure is the median of three such runs.
- A frame includes copying the finished picture to the window. The figures in the Direct2D article time the control's own painting, so the same scene reads a little higher here.
- V4 is measured at its best, writing values as one 2-D array, with screen updates and events suspended.
- Both are licensed, so no watermark is drawn.
- Data operations are measured without a screen: 10 million cells (200,000 rows × 50 columns) for values, 2 million cells (200,000 rows × 10 columns) for xlsx.
- Your numbers will vary with hardware, window size and data.
If you use V4 today
The difference between V4 and V5 is a generation of design. ReoGrid V4 will continue to be sold and supported, and ReoGrid One licenses are version-independent, so one license and the same key cover both. You can try V5 on the projects where speed matters and keep V4 wherever you need a feature V5 does not have yet.
Try it on your own data
The 30-day free trial has every feature, so you can check the speed with your data and your window size. One license covers both V4 and V5.